
Special
Report 5 June 2015
The Labor Force Participation Rate
and Its Trajectory--Why It Matters
by June Zaccone, Assoc. Prof.
of Economics (Emerita), Hofstra University and member, NJFAC Executive
Committee.
The labor force participation rate [LFPR] is the number of people in the labor force as a percent of the civilian noninstitutional*** population. To be counted in the labor force requires that one be either working or looking for work. [This count does not distinguish between documented and undocumented workers.] For example, persons who want a job but are not looking because they do not expect to find one are not counted. As the Bureau of Labor Statistics [BLS] describes them:
Discouraged workers are a subset of persons marginally attached to the labor force. The marginally attached are those persons not in the labor force who want and are available for work, and who have looked for a job sometime in the prior 12 months, but were not counted as unemployed because they had not searched for work in the 4 weeks preceding the survey. Among the marginally attached, discouraged workers were not currently looking for work specifically because they believed no jobs were available for them or there were none for which they would qualify.
Obviously, the LFPR declines with recession, as more of the
unemployed experience failure in their job search, stop looking,
and are no longer couted. The unemployment rate is thereby reduced.
As the recession ends, many of those who have dropped out may
return, slowing the decline of the unemployment rate.
U.S. LABOR FORCE PARTICIPATION RATE 16 AND OVER, 1948-May 2015 [62.9]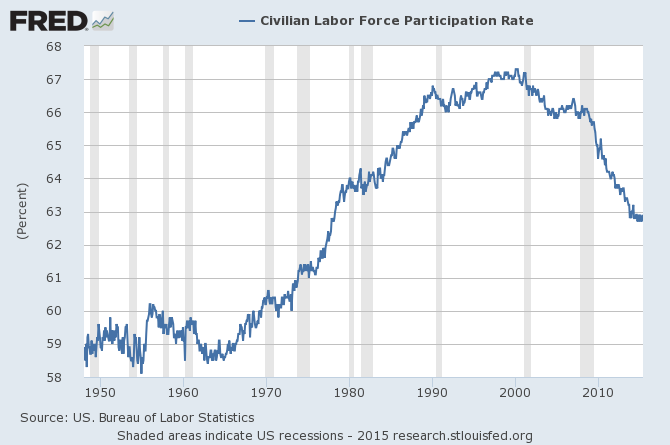
Source: https://research.stlouisfed.org/fred2/series/CIVPART
WHAT AFFECTS THE LFPR?
Among the most important are whether women, both married and
unmarried, expect and are expected to work, and whether they
have access to jobs; immigration and ethnicity and the way they
shape engagement in the labor market; educational standards
and costs; the health and age structure of the population and
what financial provisions are available for those who need or
wish to retire; and how rapidly jobs are growing, with what skill requirements, and where, which determines
incentive to enter for those who otherwise might be out of
the labor force. Disability Insurance was added to Social Security in 1956, giving workers some possibility of financial support if they need to withdraw from the labor force.
WHAT HAS HAPPENED TO THE LABOR FORCE PARTICIPATION RATE SINCE 1950? Entrance of women; disappearance of many prime-age men; re-entry of those 55 and over; higher educational standards; youth participation;changes in Social Security; effects of recession.
The LFPR at rose rapidly in the late 1970's as women entered the labor force. From 34% in 1950, women's participation rate rose to 60% in 2000. Their numbers rose from 18 million in 1950 to 66 million in 2000, their share of the labor force rising from 30% to nearly 47% in that same period.
PRIME AGE MEN: A disturbing change has been the decline in the LFPR of prime-age men: from a near-universal condition, nearly 98% in September 1954, to the latest reported level of 88.7% in March, 2015. It started sinking in the early 1960's, but the slide accelerated in the 1970's. It began at 96.0% in January 1970 and by December of 1979, was 94.3. Further declines in the 1980's and 1990's ended below 90% in December 2008, with the ongoing jobs recession. A share of this decline is a good sign, one that indicates that for some men, there is a financial possibility of withdrawing from the labor force before old age. However, this choice is unlikely for the majority of those who have withdrawn.
LABOR FORCE PARTICIPATION RATE of MEN 25-54 1/60-3/15 [88.7]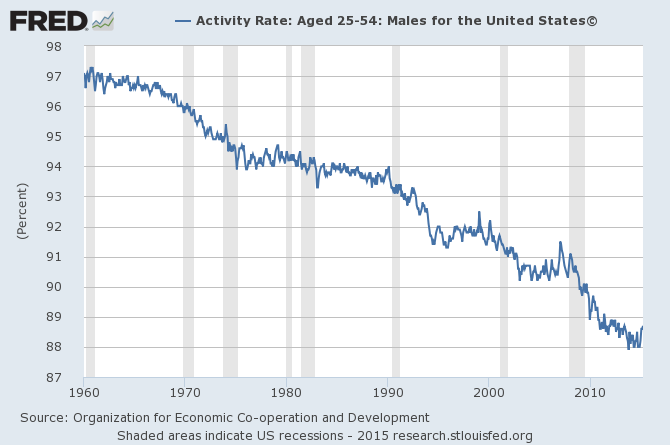
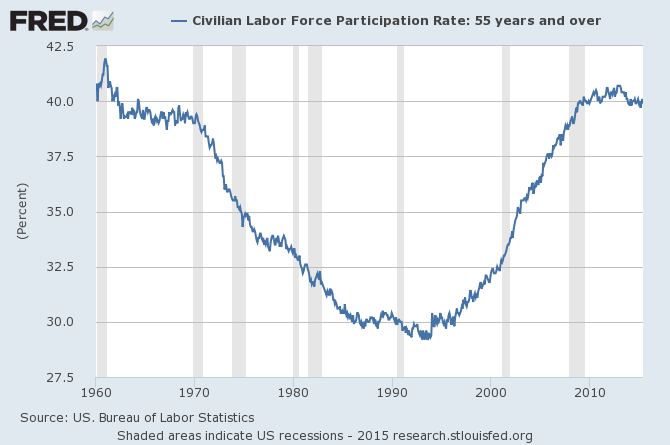
PEOPLE AGE 55 AND OVER For the work force 55 years and over, the LFPR is quite different. The LFPR of this group declimed from about 43% in the early 1950's to a minimum of 29.4% in October 1992. Since then, it has been rising and continued to rise during the recession. The latest [5/15] is 39.9. One explanation is this: "Perhaps older Americans are being forced to work more because they have not saved enough for their retirement. This lack of savings may be a result of the recent economic trends in America: stagnant wages, depleted retirement portfolios (from the 2008 financial crisis), and rising health care costs." [http://bpr.berkeley.edu/2013/04/the-declining-labor-force-participation-rate-why-this-trend-should-be-taken-seriously/] The age at which workers are eligible for full Social Security benefits is rising and will affect the choices available especially to those 62 and over. Employment of those over 55 is reflected in this headline: Old
Workers Hit New All Time High As All April Jobs Go To The "55
And Older Zero Hedge, 5/15
LFPR WORKERS 55 AND OVER 1960-5/15
EDUCATION AND THE LFPR: It is
unremarkable that LFP rises with level of education. Education
is a usually a costly investment in a marketable skill, so most
people who do so have a strong commitment to the labor market.
Further, education and income rise together, and both are linked
to better health, safer jobs, and jobs that can continue to
be done as a worker ages.
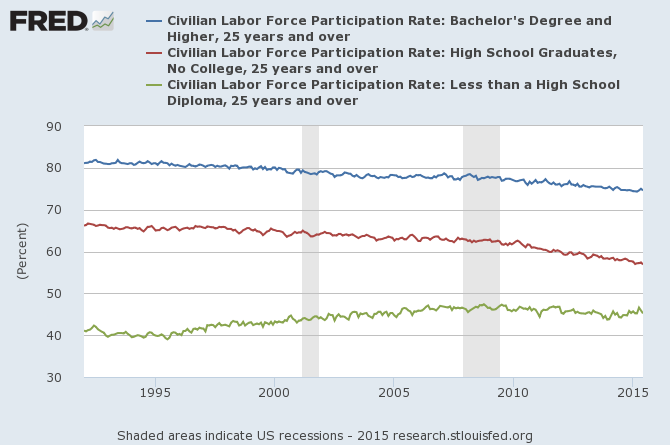
Over the
period from 1992 [for which data are available], those at the
lowest educational level have had a generally rising LFPR, though
the rate of all other educational levels fell. Immigrants were
more likely than native-born Americans to have less than
a high-school education--24.6% vs. 5.1% in 2012. And foreign-born
with less than a high-school education were also far
more likely to be in the labor force: in 2012, their rate was
59.9 compared to 36.7 for the native-born. The foreign-born with less than high-school are less likely to be eligible for Social Security and its Disability Insurance.
At least for
the 2000-05 pierod, "the labor force participation rate
for native-born youths declined, while the
rate was up for foreign-born individuals 25 years and older
with less than a high-school diploma." Rates for college
graduates were similar for the two groups.
LABOR FORCE PARTICIPATION RATE BY EDUCATION
YOUTH 16-24 AND ITS LABOR PARTICIPATION:The serious deterioration of the LFPR of young people dates from the recession of the early 2000's and of course suffered further declines with the Great Recession. From a peak of 69.7 in 8/1989, pushed up by relatively good job availability, it reached a low of 54.0 in 8/12. It has since recovered slightly 55.2 [Q1, 2015]. Of course some of these young people have been persuaded to stay in school. Their unemployment rate has been more than double the national rate, even worse for young minority workers, and it has serious consequences. "Research shows that workers who are unemployed as young adults earn lower wages for many years following their period of unemployment due to forgone work experience and missed opportunities to develop skills."
LABOR FORCE PARTICIPATION AGE 16-24, 1960-1st Qtr /2015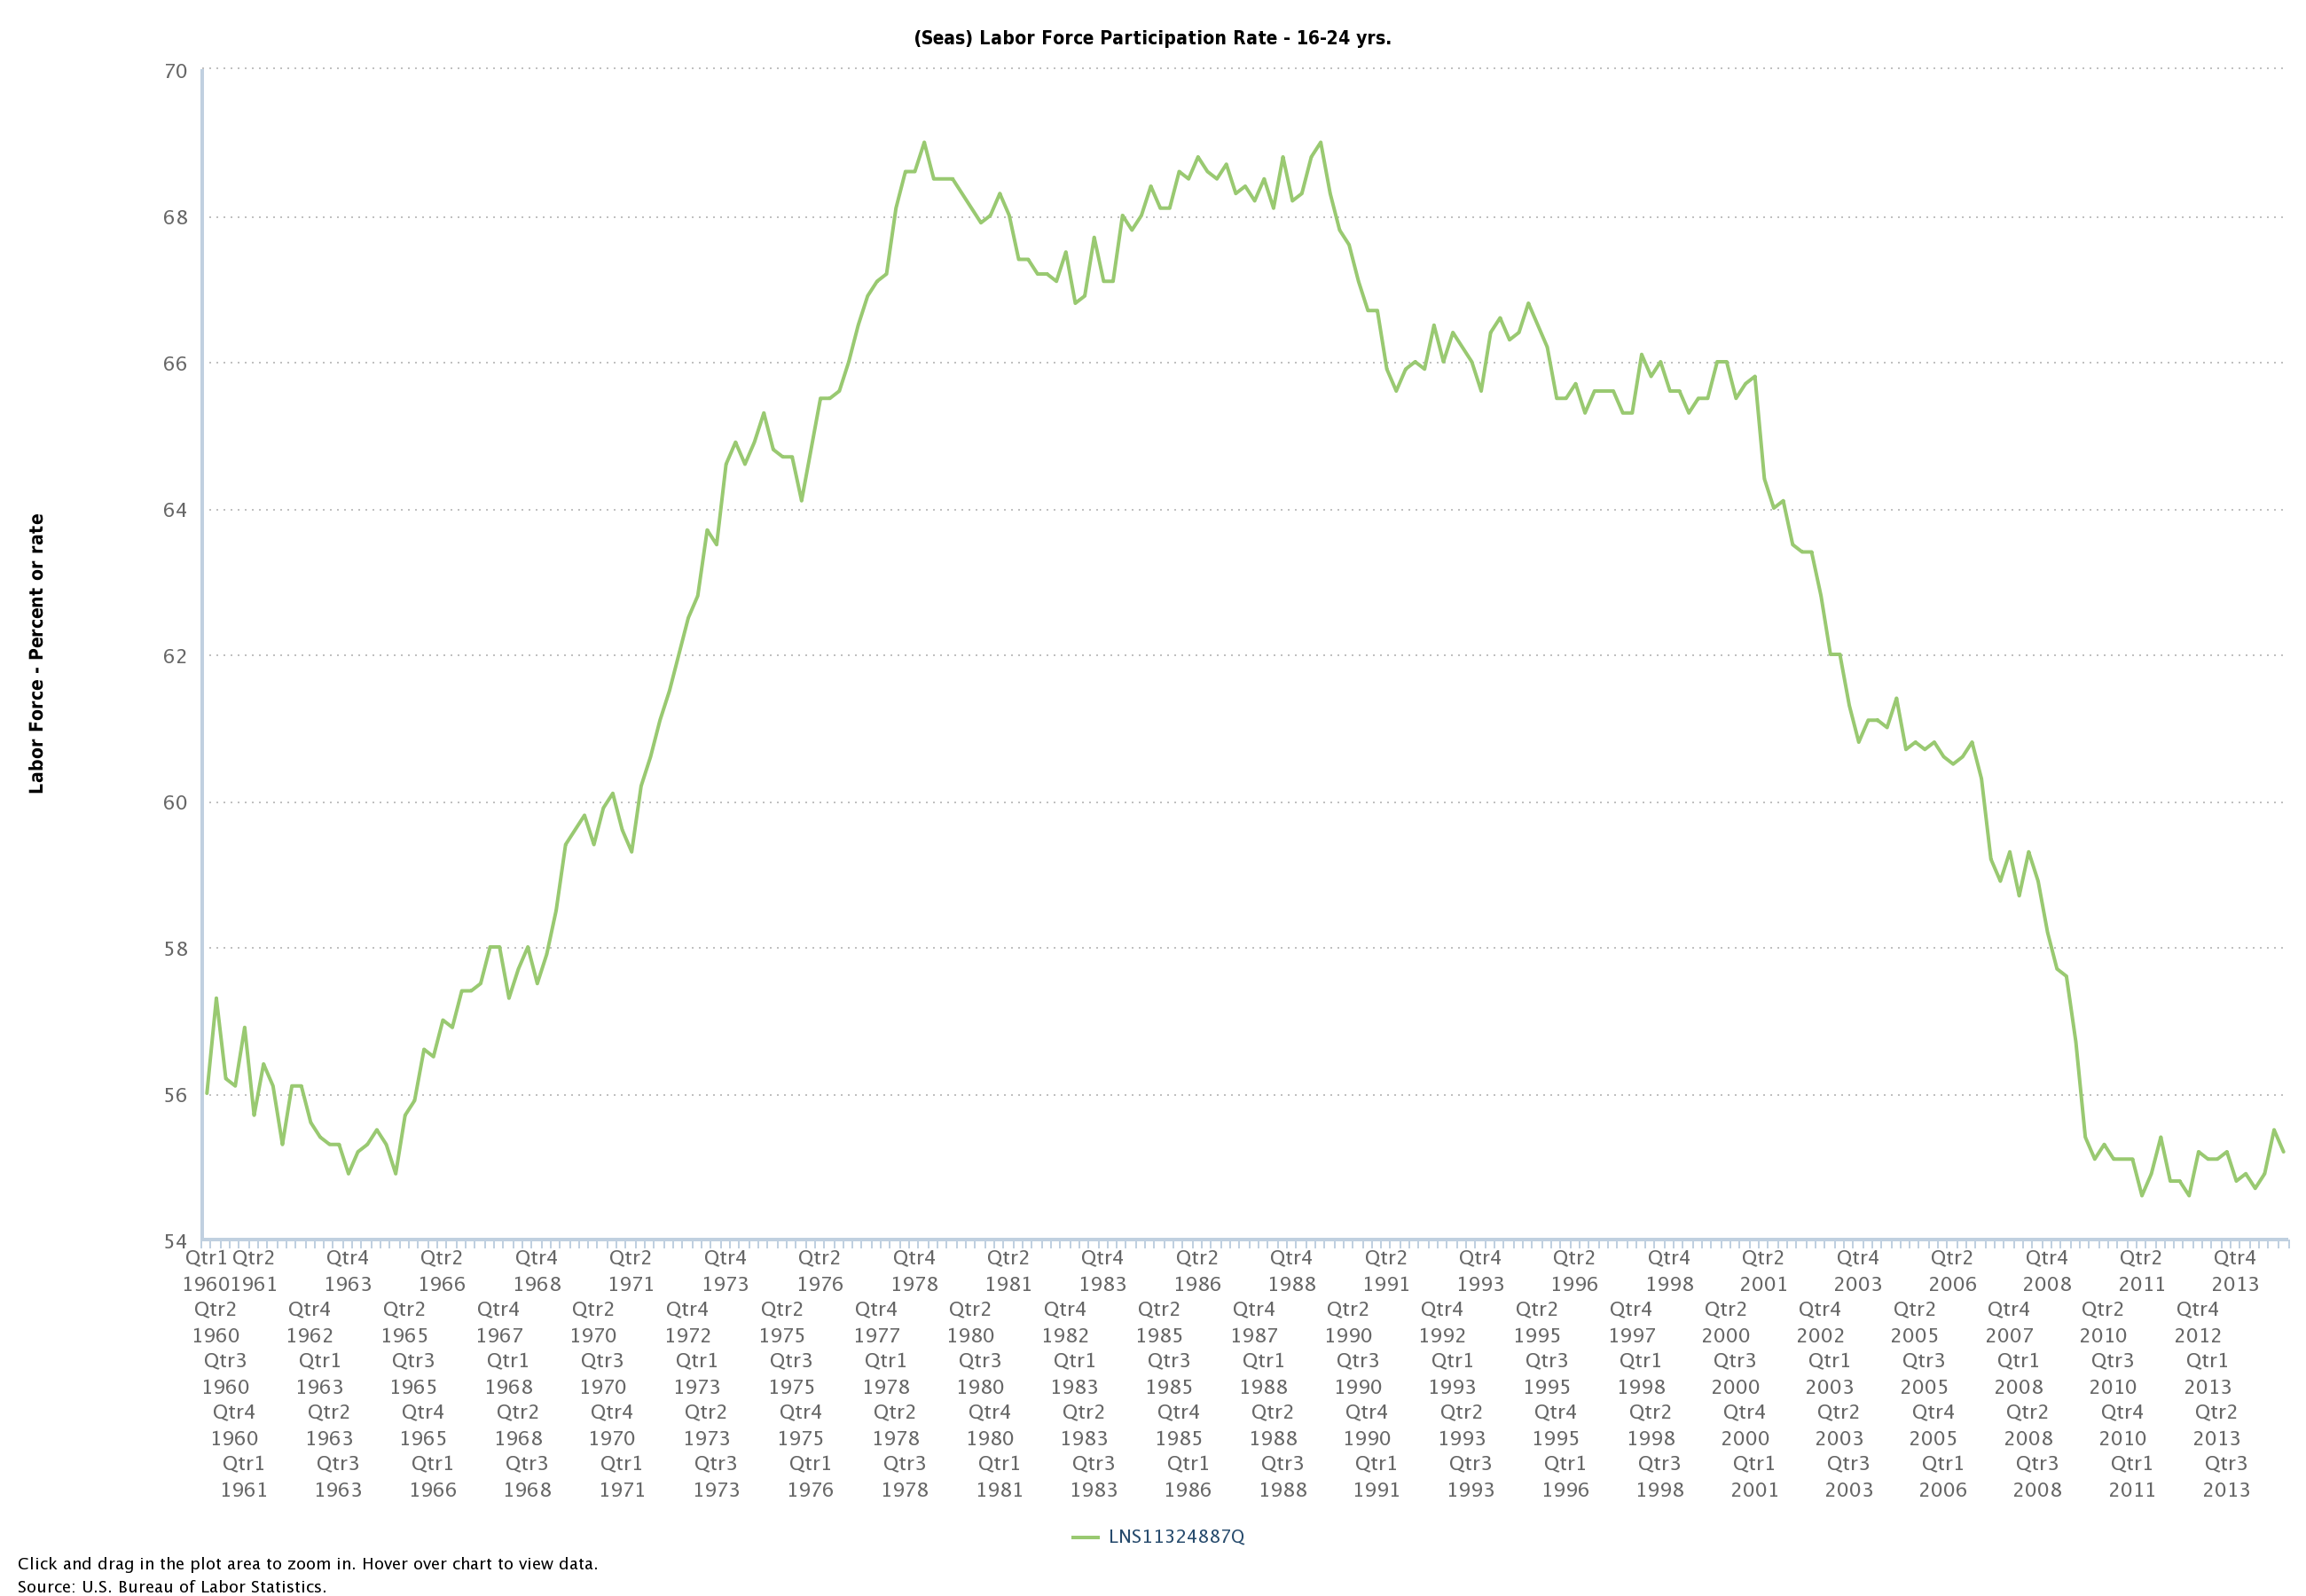
EFFECT OF RECESSION: The
recent recession has brought the LFPR from an historic peak
of 67.3 in early 2000 to a low of 62.7 in September and December of
2014. It has since recovered but only slightly, to 62.9 [5/15]. These levels have not been this low since late 1977, nearly 40 years. The population has aged somewhat over these few
years, so the LFPR would be expected to decline but only slightly. Our employment problems are reflected in the number of full-time jobs: at 121.4 million [May 2015], they are still about half
a million below their pre-recession peak of 121.9 million
reached in November 2007. See http://www.bls.gov/web/empsit/cpseea06.htm for full-time workers.
Labor Force Participation Rate vs. Unemployment Rate
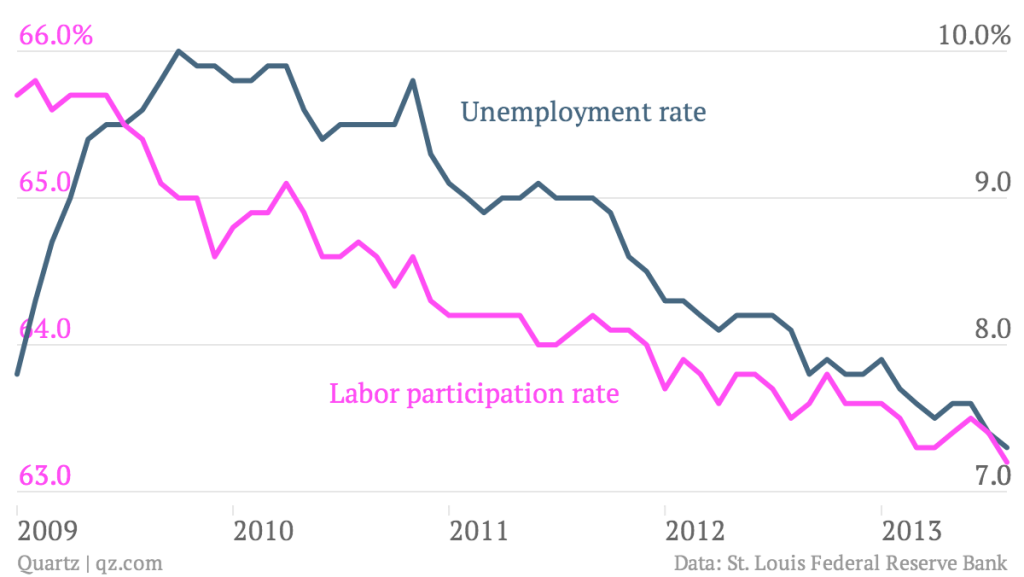
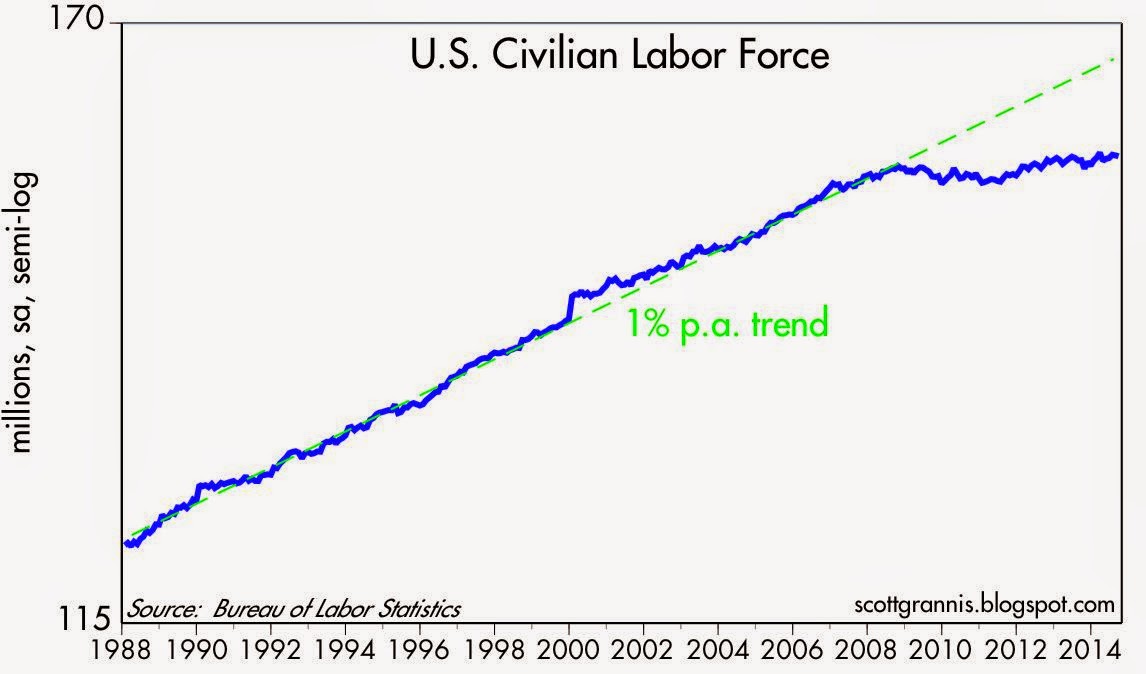
The recession has led to a decline in expected labor force growth.
*"For the Employment Rate, an Uptick," Economix, NYTimes, 7/5/13
**Leonhardt, "The Age Equation in Employment Numbers," Economix, NYTimes, 8/2/13
***Note that" noninstitutional" means that people in military service are not counted, nor are those in prison, "mental facilities, or homes for the aged".
All data for LFPR are seasonally adjusted.
My colleague, Helen Ginsburg, contributed helpful comments and suggestions, for which I am grateful.
