|
JANUARY 2010 UNEMPLOYMENT DATA*
(U.S.
BUREAU OF LABOR STATISTICS)
OFFICIAL UNEMPLOYMENT:
9.7%
A year earlier, the number of unemployed
persons was 11.9
million, and the jobless rate was 7.7 percent. [BLS]
| White |
8.7% |
| African
American |
16.5% |
| Hispanic |
12.6% |
| Asian** |
8.4% |
| Persons with a disability ** |
15.2% |
| Men
20 years and over |
10.0% |
| Women
20 years and over |
7.9% |
| Teen-agers
(16-19 years) |
26.4% |
| Black
teens |
43.8% |
| Officially
unemployed |
14.8
million |
HIDDEN UNEMPLOYMENT
| Working
part-time because can't find a full-time job: |
8.3
million |
| People
who want jobs but are
not looking so are
not counted in official statistics (of which about 2.5 million**
searched for work during the prior 12 months and were available
for work during the reference week.) |
6.0
million |
|
Total:
29.1 million (18.3% of the labor force)
|
Source: http://www.bls.gov/news.release/pdf/empsit.pdf
**Not seasonally adjusted.
*See Uncommon Sense #4 for an explanation of the unemployment measures.
In addition, millions
more were working full-time, year-round, yet earned
less than the official poverty level for a family of four. In
2008, the latest
year available, that number was 17.8 million, 17.1 percent of
full-time, full-year workers (estimated from Current
Population Survey, Bur. of the Census, 2009).
In November,
2009, the latest month available, the number of job
openings was only 2.4 million, according to the BLS, Job
Openings and
Labor Turnover Estimates, January 12, 2010.+
Thus there are more than 12 job-wanters for each available job.[Numbers
are not comparable with previous months as methods have been revised.]
Comparing Long-Term Unemployment: 1999-2009

MONTHLY NET CHANGE IN
NON-FARM EMPLOYMENT, 12/07-9/09
Source: http://www.bls.gov/ces/
Change in Payroll Employment, Historical Data
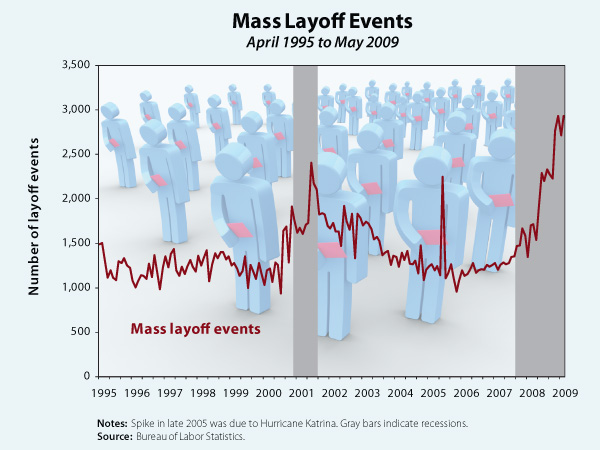
Mass
layoffs: "Employers
took 1,726 mass layoff actions in December that resulted in the
separation of 153,127 workers, seasonally adjusted, as measured
by new filings for unemployment insurance benefits during the
month, the U.S. Bureau of Labor Statistics reported today. Each
action involved at least 50 persons from a single employer. The
number of mass layoff events in December decreased by 87 from
the prior month, and the number of associated initial claims decreased
by 10,696. Both figures reached their lowest level since July
2008. In December, 433 mass layoff events were reported in the
manufacturing sector, seasonally adjusted, resulting in 44,072
initial claims. Both figures decreased over the month to their
lowest levels since November and August 2007, respectively.
....
REVIEW OF 2009 For all of 2009, on a not seasonally
adjusted basis, the total numbers of mass layoff events, at 28,030,
and initial claims, at 2,796,456, reached their highest annual
levels on record. Among the 19 major industry sectors in the private
economy, manufacturing had the most initial claims in 2009 (1,137,106),
followed by administrative and waste services (294,709) and construction
(205,765). Manufacturing also had the largest over-the-year increase
in total annual initial claims (+266,796), with retail trade (+57,283)
and administrative and waste services (+48,039) experiencing the
next largest increases. Among the major industry sectors, 12 registered
series highs for both mass layoff events and initial claims in
2009: mining; construction; wholesale trade; retail trade; transportation
and warehousing; finance and insurance; real estate and rental
and leasing; management of companies and enterprises; administrative
and waste services; health care and social assistance; arts, entertainment,
and recreation; and accommodation and food services.
....
Among the 4 census regions, the Midwest reported the highest number
of mass layoff initial claims filed during 2009 (892,202), followed
by the West and the South. All 4 regions experienced over-the-year
annual increases, with the largest increases taking place in the
Midwest (+215,611). The Midwest, Northeast, and South also reached
program highs for total initial claims in 2009. ...."
(BLS, January 27, 2010)
Source: http://www.epi.org/publication/snapshot_20090701/
+"Over the 12 months
ending in November, the job openings rate (not seasonally adjusted)
decreased for total nonfarm and total private. Although the rate
was essentially unchanged for government, it increased in federal
government and decreased in state and local government. The job
openings rate decreased in many industries: mining and logging;
retail trade; transportation, warehousing, and utilities; real
estate and rental and leasing; educational services; health care
and social assistance; and other services. The job openings rate
decreased in the South."
The
National Jobs for All Coalition is a project of the Council on
Public and International Affairs. |