APRIL
2013 UNEMPLOYMENT DATA*
(U.S.
BUREAU OF LABOR STATISTICS)
OFFICIAL
UNEMPLOYMENT: 7.5%
A year earlier, the number of unemployed
persons was 12.5
million, and the jobless rate was 8.1 percent. [BLS]
| White |
6.7% |
| African
American |
13.2% |
| Hispanic |
9.0% |
| Asian** |
5.1% |
| Persons with a disability** |
12.9% |
| Men
20 years and over |
7.1% |
| Women
20 years and over |
6.7% |
| Teens
(16-19 years) |
24.1% |
| Black
teens |
40.5% |
| Officially
unemployed |
11.7
million |
HIDDEN UNEMPLOYMENT
| Working
part-time because can't find a full-time job: |
7.9
million |
| People
who want jobs but are
not looking so are
not counted in official statistics (of which about 2.3 million**
searched for work during the prior 12 months and were available
for work during the reference week.) |
6.4
million |
|
Total: 26.0 million (16.1% of the labor force)
|
Source: http://www.bls.gov/news.release/pdf/empsit.pdf
See also Current
Employment Statistics--Highlights
**Not
seasonally adjusted.
*See Uncommon Sense #4
for an explanation of the unemployment measures.
In addition,
millions more were working full-time, year-round, yet earned less
than the official poverty level for a family of four. In 2011,
the latest year available, that number was 17.9 million, 17.6
percent of full-time, full-year workers (estimated from Current
Population Survey, Bur. of the Census, 9/2012).
"In
February 2013, the latest month available, the number of job openings
was 3.9 million,
up from January. This was the highest number of job openings since May 2008. In February, the number of openings rose in health care and social assistance, accommodation and food services, and state and local government. The number of job openings increased in the Midwest region." Job
Openings and Labor Turnover Estimates, April 9, 2013.+
Thus there are now nearly 7 job-wanters for each available job.
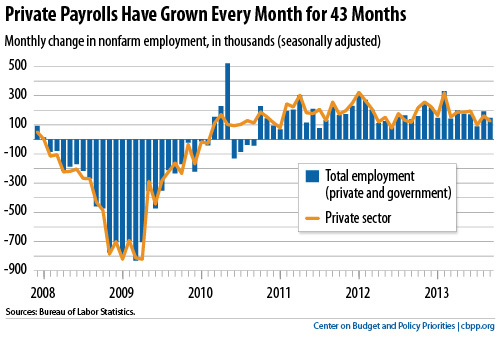
Private Payroll Employment Has Grown For 37 Monthscbpp 4/13
http://www.offthechartsblog.org/
Employment-population
ratio 1/1948 to 3/2013
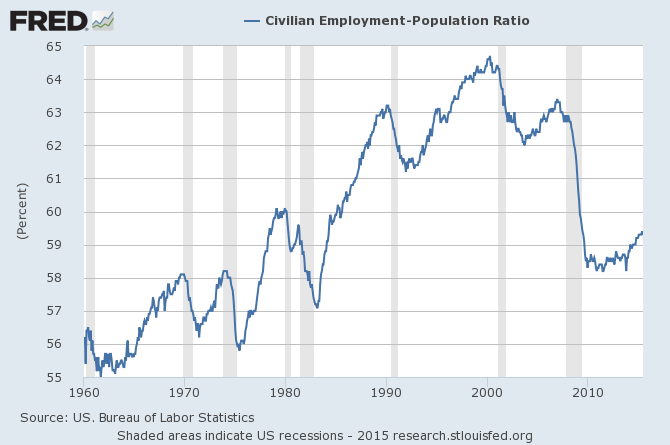
http://www.cbpp.org/cms/index.cfm?fa=view&id=3252
+"The
number of job openings in February (not seasonally adjusted) was up over the year for total nonfarm and total private, and was little changed for government. Job openings increased over the year for
construction, finance and insurance, accommodation and food services, and state and local government. The West region experienced an increase in job openings
over the year."
|