|
JULY
2009 UNEMPLOYMENT DATA*
(U.S.
BUREAU OF LABOR STATISTICS)
OFFICIAL UNEMPLOYMENT:
9.4%
A year earlier, the number of unemployed
persons was 8.9
million, and the jobless rate was 5.8 percent. [BLS]
| White |
8.6% |
| African
American |
14.5% |
| Hispanic |
12.3% |
| Asian** |
8.3% |
| Persons with a disability** |
15.1% |
| Men
20 years and over |
9.8% |
| Women
20 years and over |
7.5% |
| Teen-agers
(16-19 years) |
23.8% |
| Black
teens |
35.7% |
| Officially
unemployed |
14.5
million |
HIDDEN UNEMPLOYMENT
| Working
part-time because can't find a full-time job: |
8.8
million |
| People
who want jobs but are
not looking so are
not counted in official statistics (of which about 2.3 million**
searched for work during the prior 12 months and were available
for work during the reference week.) |
6.0
million |
|
Total:
29.3 million (18.3% of the labor force)
|
Source: http://www.bls.gov/news.release/pdf/empsit.pdf
**Not seasonally adjusted.
*See Uncommon Sense #4 for an explanation
of the unemployment measures.
In addition, millions
more were working full-time, year-round, yet earned
less than the official poverty level for a family of four. In
2007, the latest
year available, that number was 17.6 million, 16.2 percent of
full-time workers (estimated from Current Population Survey, Bur.
of the Census, 2008).
In
June, 2009, the latest month available, the number of job
openings was only 2.6 million, according to the BLS,
Job Openings
and
Labor Turnover Estimates, August 12, 2009.+ Thus there
are more than 11 job-wanters for each available job.[Numbers
are not comparable with previous months as methods have been revised.]
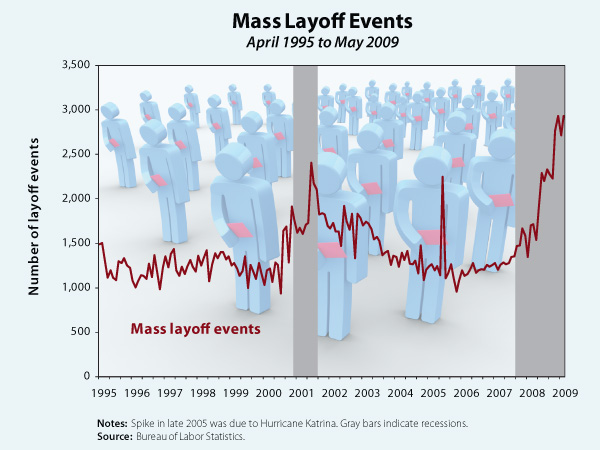
Mass
layoffs: "Employers
initiated 2,994 mass layoff events in the second quarter of 2009
that resulted in the separation of 534,881 workers from their
jobs for at least 31 days, according to preliminary figures released
by the U.S. Department of Labor's Bureau of Labor Statistics.
Both the numbers of extended mass layoff events and associated
separations were record highs for a second quarter (with data
available
back to 1995).
Second quarter program highs in the number of
separations were recorded in 7 of 18 major industry sectors, all
four geographic regions, and fourteen states. Separations due
to business demand reasons (especially slack work/insufficient
demand) set a second quarter program high, while separations for
financial reasons reached its highest second quarter level since
2001. Thirty-eight percent of employers reporting an extended
layoff in the second quarter of 2009 indicated they anticipated
some type of recall, this was down from 51 percent a year earlier,
and was the lowest proportion of anticipated recalls for a second
quarter in program history (with data available back to 1995).
Second quarter 2009 layoff data are preliminary and are subject
to revision. ....
Manufacturing firms reported 932 extended mass layoff events involving
166,240 separations in the second quarter of 2009. The number
of events in manufacturing reached a second quarter program high,
while associated worker separations for this industry sector were
at its highest second quarter level since 1998 (with data available
back to 1995). ....In the second quarter
of 2009, seven major industry sectors reported second quarter
program highs in terms of the number of worker separations—mining;
construction; wholesale trade; transportation and warehousing;
real estate and rental and leasing; health care and social assistance;
and accommodation and food services." (BLS, August 12, 2009)
Source: http://www.epi.org/publication/snapshot_20090701/
+"The
job openings rate was unchanged in June; the rate has held at
1.9 percent since March 2009. The number of job openings varied
little over the last four months, after falling by 2.2 million,
or 45 percent, from June 2007 to March 2009. The job openings
rate was little changed in June in every industry and region."
 Source:
http://www.americanprogress.org/issues/economy/news/2009/04/03/5945/no-good-news-for-workers/ Source:
http://www.americanprogress.org/issues/economy/news/2009/04/03/5945/no-good-news-for-workers/
|