|
AUGUST 2009 UNEMPLOYMENT DATA*
(U.S.
BUREAU OF LABOR STATISTICS)
OFFICIAL UNEMPLOYMENT:
9.7%
A year earlier, the number of unemployed
persons was 9.6
million, and the jobless rate was 6.2 percent. [BLS]
| White |
8.9% |
| African
American |
15.1% |
| Hispanic |
13.0% |
| Asian** |
7.5% |
| Persons with a disability** |
16.9% |
| Men
20 years and over |
10.1% |
| Women
20 years and over |
7.6% |
| Teen-agers
(16-19 years) |
25.5% |
| Black
teens |
34.7% |
| Officially
unemployed |
14.9
million |
HIDDEN UNEMPLOYMENT
| Working
part-time because can't find a full-time job: |
9.1
million |
| People
who want jobs but are
not looking so are
not counted in official statistics (of which about 2.3 million**
searched for work during the prior 12 months and were available
for work during the reference week.) |
5.6
million |
|
Total:
29.6 million (18.5% of the labor force)
|
Source: http://www.bls.gov/news.release/pdf/empsit.pdf
**Not seasonally adjusted.
*See Uncommon Sense #4 for an explanation
of the unemployment measures.
In addition, millions
more were working full-time, year-round, yet earned
less than the official poverty level for a family of four. In
2007, the latest
year available, that number was 17.6 million, 16.2 percent of
full-time workers (estimated from Current Population Survey, Bur.
of the Census, 2008).
In
July, 2009, the latest month available, the number of job
openings was only 2.4 million, according to the BLS,
Job Openings
and
Labor Turnover Estimates, September 9, 2009.+ Thus
there are more than 12 job-wanters for each available job.[Numbers
are not comparable with previous months as methods have been revised.]
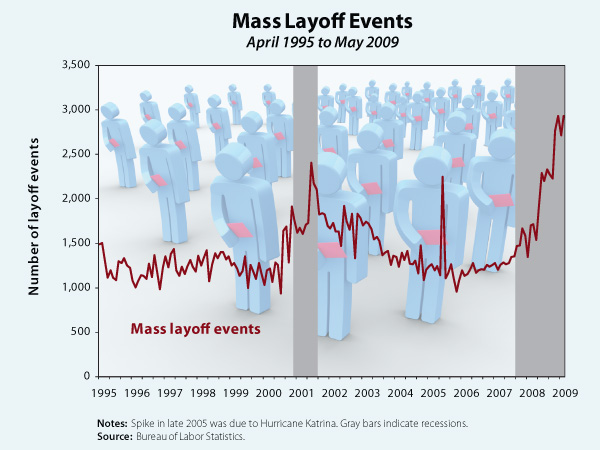
Mass
layoffs: "In August,
employers took 2,690 mass layoff actions involving 259,307 workers.
Mass layoff events increased by 533 and associated initial claims
by 52,516 from July. Over the year, events increased by 803 and
initial claims by 70,356. Year-to-date events and initial claims
reached new program highs. ....
Seven of the 19 major industry sectors reported
program highs in terms of average weekly initial claimants for
the month of August: construction; wholesale trade; retail trade;
management of companies and enterprises; educational services;
arts, entertainment, and recreation; and accommodation and food
services. (Average weekly analysis mitigates the effect of differing
lengths of months.....
Among the 4 census regions, the West registered
the highest number of initial claims in August due to mass layoffs
(36,897), followed by the Midwest (32,197) and the South (29,486).
(See table 5.) Average weekly initial claims associated with mass
layoffs increased over the year in 3 of the 4 regions, with the
Northeast experiencing the largest increase (+2,064). In 2009,
the Northeast reported its highest August level of average weekly
initial claims (6,611) in program history." (BLS, September
25, 2009)
Source: http://www.epi.org/publication/snapshot_20090701/
+"The
job openings rate was little changed in July in every industry
except retail where the rate declined. The job openings rate decreased
in the Northeast and was little changed in the remaining regions....Over
the 12 months ending in July, the job openings rates (not seasonally
adjusted) decreased for total nonfarm, total private, government,
and the majority of industries. The exceptions were information
and arts, entertainment, and recreation, in which the rates were
little changed. All four regions experienced a drop in the job
openings rate over the 12 months ending in July."
 Source:http://www.americanprogress.org/issues/economy/news/2009/04/03/5945/no-good-news-for-workers/ Source:http://www.americanprogress.org/issues/economy/news/2009/04/03/5945/no-good-news-for-workers/
The
National Jobs for All Coalition is a project of the Council on
Public and International Affairs. |