|
AUGUST
2011 UNEMPLOYMENT DATA*
(U.S.
BUREAU OF LABOR STATISTICS)
OFFICIAL UNEMPLOYMENT:
9.1%
A year earlier, the number of unemployed
persons was 14.8
million, and the jobless rate was 9.6 percent. [BLS]
| White |
8.0% |
| African
American |
16.7% |
| Hispanic |
11.3% |
| Asian** |
7.1% |
| Persons with a disability ** |
16.1% |
| Men
20 years and over |
8.9.% |
| Women
20 years and over |
8.0.% |
| Teens
(16-19 years) |
25.4% |
| Black
teens |
46.5% |
| Officially
unemployed |
14.0
million |
HIDDEN UNEMPLOYMENT
| Working
part-time because can't find a full-time job: |
8.8
million |
| People
who want jobs but are
not looking so are
not counted in official statistics (of which about 2.6 million**
searched for work during the prior 12 months and were available
for work during the reference week.) |
6.5
million |
|
Total:
29.3 million (18.3% of the labor force)
|
Source: http://www.bls.gov/news.release/pdf/empsit.pdf
**Not seasonally adjusted.
*See Uncommon Sense #4 for an explanation of the unemployment measures.
In addition, millions
more were working full-time, year-round, yet earned less than
the official poverty level for a family of four. In 2009, the
latest year available, that number was 16.3 million, 16.4 percent
of full-time, full-year workers (estimated from Current
Population Survey, Bur. of the Census, 2010).
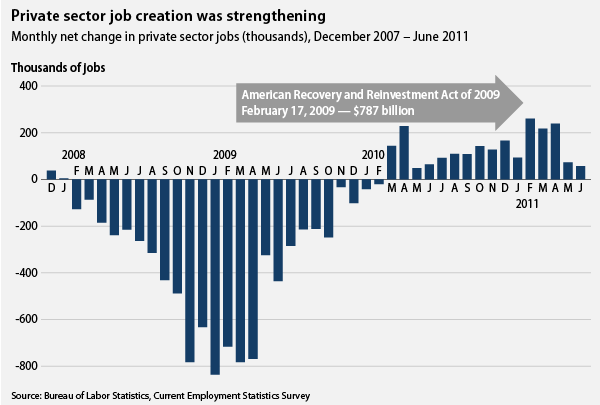
In May, 2011,
the latest month available, the number of job openings was 3.1
million, "essentially unchanged from May. Although
the number of job openings in June was 997,000 higher than in
July 2009 (the series trough), it has been relatively flat since
February 2011 and remains well below
the 4.4 million openings when the recession began in December
2007."
Job Openings
and Labor Turnover Estimates, August 10, 2011.+ Thus
there are now more than 9 job-wanters for each available job.
Source:http://www.americanprogress.org/issues/2011/07/jobs_debt
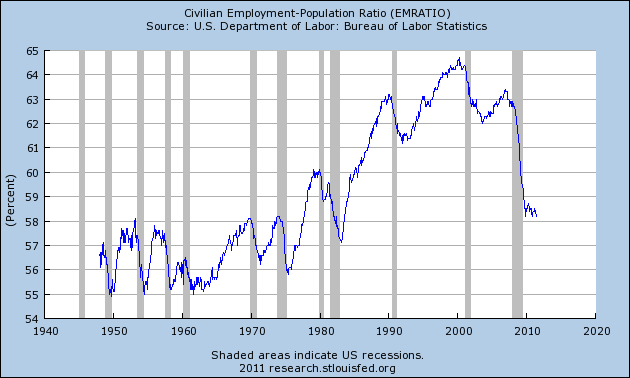
Employment-population
ratio 1/1948 to 6/2011
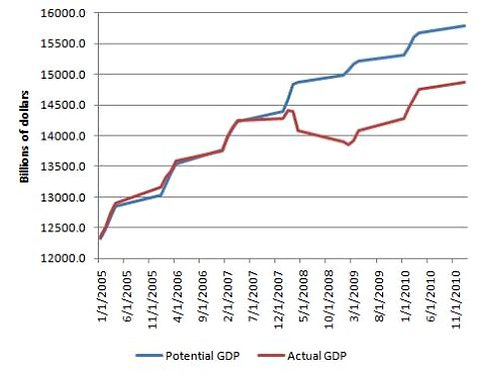
The
Waste [of output] by Paul Krugman August 11, 2011, blog
cumulative loss because of recession: $2.8 Tr.
Mass
layoffs:
In the second quarter of 2011, 1,624 extended
mass layoff events involved 265,147 worker separations. Total
events and worker separations have decreased over the year for
seven consecutive quarters. Both events and separations in the
manufacturing sector declined to series' lows during the quarter.
8/11
Mass
layoffs: Review
of 2010 BLS, 2/11/11
For all of 2010, employers reported 7,158 extended mass layoff
actions, affecting 1,213,638 workers. Compared to 2009, the number
of events decreased by 39 percent and the number of separations
decreased by 42 percent, the first over-the-year decline for both
measures since 2005. The annual average national unemployment
rate increased from 9.3 percent in 2009 to 9.6 percent in 2010,
and private nonfarm payroll employment decreased by 0.8 percent,
or 914,000.
Industry Distribution of Extended Layoffs
In the private nonfarm economy, manufacturing reported the largest
number of separations, despite reaching a program low in 2010
(with annual data available back to 1996). Construction had the
next highest number of separations. Educational services reported
program highs in both layoff events and separations in 2010.
....
+
"The number of job openings in June
(not seasonally adjusted) rose from a year earlier for total nonfarm
and total private. The number of job openings increased in mining
and logging, retail trade, professional and business services,
and health care and social assistance. Job openings decreased
over the year for federal government.."
|