JANUARY
2014 UNEMPLOYMENT DATA*
(U.S.
BUREAU OF LABOR STATISTICS)
OFFICIAL
UNEMPLOYMENT: 6.6%*
A year earlier, the number of unemployed
persons was 12.3
million,
and the jobless rate was 7.9 percent.
[BLS]
| White |
5.7% |
| African
American |
12.1% |
| Hispanic |
8.4% |
| Asian** |
4.8% |
| Persons with a disability** |
13.3% |
| Men
20 years and over |
6.2% |
| Women
20 years and over |
5.9% |
| Teens
(16-19 years) |
20.7% |
| Black
teens |
38.0% |
| Officially
unemployed |
10.2 million |
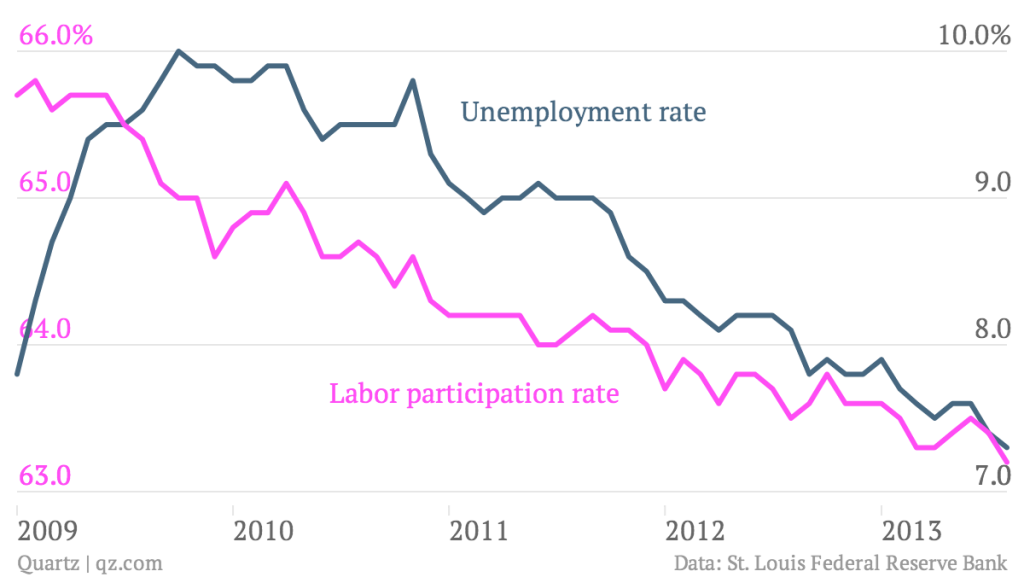
*If the LFPR were at its pre-recession level, the unemployment
rate in January
2014 would have been 9.9% instead of
6.6%. [See "The Labor Force
Participation Rateand Its Trajectory"]
HIDDEN UNEMPLOYMENT
| Working
part-time because can't find a full-time job: |
7.3
million |
| People
who want jobs but are
not looking so are
not counted in official statistics (of which about 2.3 million**
searched for work during the prior 12 months and were available
for work during the reference week.) |
6.3
million |
|
Total:
23.8 million (14.7%
of the labor force) |
Source: http://www.bls.gov/news.release/pdf/empsit.pdf
See also
Current
Employment Statistics--Highlights
**Not
seasonally adjusted.
*See Uncommon Sense #4 for an
explanation of the unemployment measures, and Is
the Decline in the Labor Force Participation Rate During This
Recession Permanent?.
In addition,
millions more were working full-time, year-round, yet earned
less than the official poverty level for a family of four. In
2012, the latest year available, that number was 18.0 million,
17.5 percent of full-time, full-year workers (estimated from
Current
Population Survey, Bur. of the Census, 9/2013).
In
November 2013, the latest month available, the number of job
openings was 4.0 million.
"The
number of openings
was little changed in total private and government, as well
as in all industries and in all four regions…"
Job
Openings and Labor Turnover Summary, January
17, 2014.+
Thus there are about 6 job-wanters
for each available job.
MISSING
WORKERS:
THE MISSING PART OF THE UNEMPLOYMENT STORY
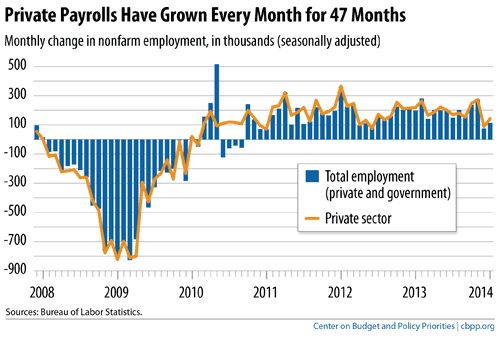
Private
Payroll Employment Has Grown For 47 Months
(cbpp
2/14)
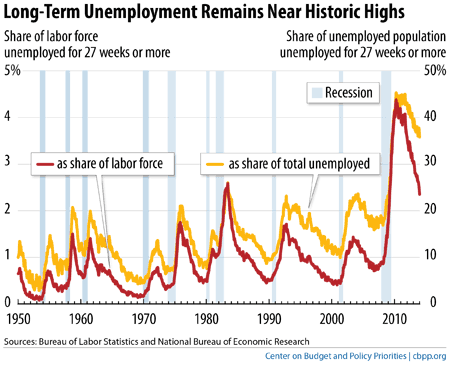
Long-Term
Unemployment Remains Near Historic
Highs
(cbpp 2/14)
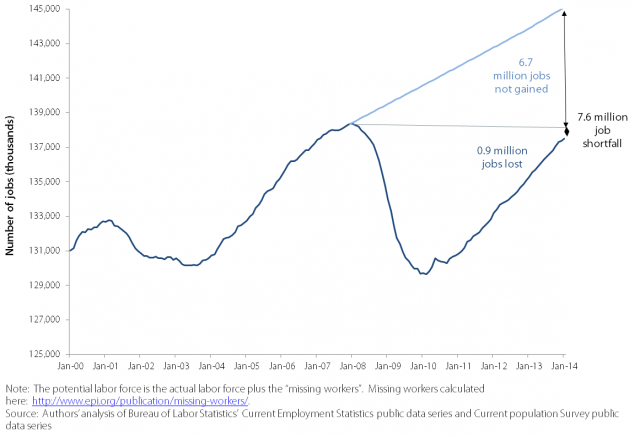
Missing Jobs: How many jobs
we should have had (epi)
"We lost 8,695,000 jobs in
the downturn, but we have since gained
back 7,844,000, so we are now “only” 851,000 jobs
below where we
were when the recession began in December
2007." --Heidi
Shierholz, EPI
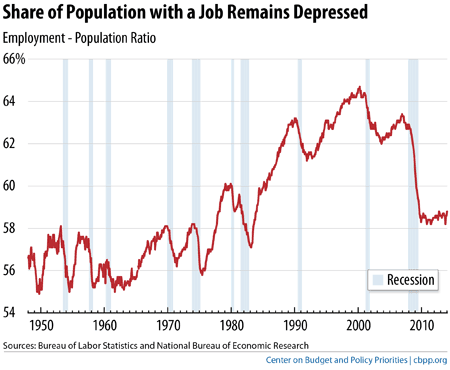
Labor Force Participation Rate vs. Unemployment
Rate 9/6/13
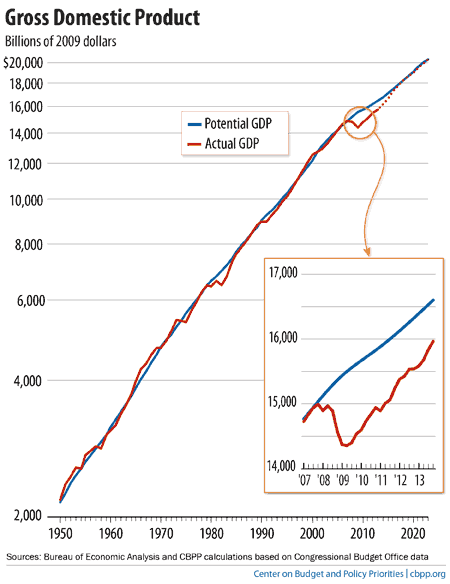
GDP
Fell Far Below What the Economy
Was
Capable of Producing (epi)
+"There
were 4.0 million job openings in November, little changed from
October. The number of openings was little changed in
total private and government, as well as in all industries and
in all four regions. The number of job openings (not seasonally
adjusted) was essentially unchanged over the year for total
nonfarm, total private, and government..
Over the year, the number of job openings increased in several
industries but decreased in federal government. The West region
experienced an increase in job openings over the 12 months ending
in November.” (http://www.bls.gov/news.release/pdf/jolts.pdf)